[Woolly Mammoths: Do ice cores show many tens of thousands
of years? by Michael Oard] In the sequence of events in the
creation-Flood Ice Age model, at the end of deglaciation, the Ice Age was
effectively over. Yet some ice sheets continued to grow. The Greenland and
Antarctica ice sheets are remnants left over from the post-Flood Ice Age
(figures 12.1 and 12.2). They were protected from melting by their location in
the polar latitudes and by the high altitude of the ice deposited during the Ice
Age. The altitude of the ice is an important factor since the atmosphere cools
at an average of 3.6°F per 1,000 feet (6°C per 1,000 m).
It is interesting to note that the Greenland and Antarctica ice
sheets may never have grown to their present size, if it were not for the
initial thickness of ice at the end of the Ice Age. Some scientists believe that
if the ice somehow disappeared, it probably would not return in the present
climate. This is especially the case for Greenland.
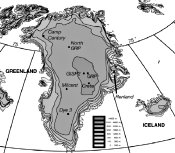
Figure 12.1. Map of
Greenland showing ice thickness above sea level with major ice core
locations. (Redrawn by Ron Hight.)
View full-size. |
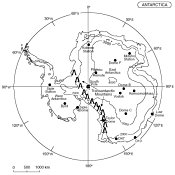
Figure 12.2. Map of
Antarctica showing ice thickness above sea level with major ice core
locations. (Redrawn by Ron Hight.)
View full-size. |
Many ice cores have been drilled deep
into both the Antarctica and Greenland ice sheets since the 1960s (see figures
12.1 and 12.2). It is observed today that these ice sheets incorporate dust,
acids, pollution, etc. that cycle with the seasons. Near the top of the ice
sheets, annual layers can be distinguished by measuring the many variables
related to the seasons. From the top of the Greenland ice sheet, glaciologists
further claim that they can count the annual layers downward, like counting the
rings in a tree to determine its age. They arrive at 110,000 years for the top
90 percent of the ice sheet.1 Is their
claim justified?
Are there 110,000 annual layers in the Greenland ice sheet?
The claimed 110,000 annual layers in the GISP2 ice core to near
the bottom of the Greenland ice sheet is not a straightforward deduction. The
annual layers, indeed, show up well near the top of the ice sheet. However, the
situation becomes much more complicated deeper down in the ice sheet.
Essentially, the uniformitarian scientists must make assumptions for the bottom
and middle portion of the ice sheet in order to determine the annual layers.
The main assumption is that the earth is very old — billions of
years old. They assume that the Greenland and Antarctica ice sheets have
existed for many millions of years. Furthermore, they believe these ice sheets
have more or less maintained their present height in a state of equilibrium
during all this time. They think the amount of snow and ice added each year is
approximately balanced by the ice that is lost by melting and calving of
icebergs into the ocean. Because of their assumptions, uniformitarian scientists
believe that the annual layers thin drastically as they are covered by more snow
and ice (figure 12.3). The upshot of their assumptions is that the amount
of annual layer compression believed to have occurred depends upon how old
one believes the ice to be. For an ice sheet in equilibrium for millions of
years, the annual layers would, theoretically, thin rapidly and become almost
paper-thin near the bottom of the ice.
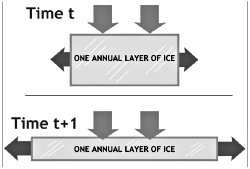
Figure 12.3. Annual layers of ice are compressed
vertically and stretched horizontally due to pressure from
accumulating snow and ice above. |
On the other hand, if the ice built up
rapidly, as in the creationist model during the Ice Age, the annual layers would
be very thick at the bottom and thin upward to the present average annual layer
thickness. There would be some compression of ice during this short time, of
course, but far less than the uniformitarian model suggests.2
Figure 12.4 shows these contrasting views of the annual layer thickness with
depth.
The assumed thickness of the annual
layers is important because it constrains the expected annual thickness
in the measurements. The measurements can deviate a little from the assumed
annual layer thickness but not by much. For instance, in the oxygen isotope
method, uniformitarian scientists normally need eight measurements per annual
cycle to pick up the “annual” signature. As an example, halfway down the GRIP
Greenland ice core at about one mile (1,600 m) deep, uniformitarian scientists
believe the annual layer thickness is 4 inches (10 cm).5
The measurements for oxygen isotopes would then be spaced every 1/2 inch (1 cm)
apart.
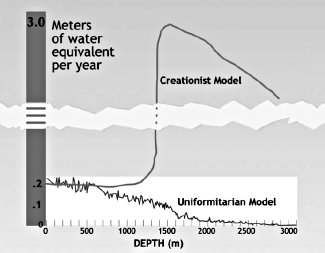
Figure 12.4. The
thickness of annual ice layers down the GRIP ice core on central
Greenland, calculated according to the uniformitarian3
and creationist4 models. |
Since the creationist model postulates
an annual layer thickness significantly thicker, say 12 inches (30 cm) as an
example, the uniformitarians have taken more measurements than needed and are,
therefore, measuring multiple cycles of oxygen isotopes within one year. This is
how the number of annual layers becomes greatly exaggerated.6,
7
As already stated, the uniformitarian
and creationist estimates of annual thickness are much the same at the top of
the Greenland ice sheet. The difference between the two models becomes more and
more significant deeper in the ice core. Because of extreme annual layer
thinning at the bottom of the core in the uniformitarian model compared to the
creationist model, the uniformitarian scientists may be counting 100 layers that
they think are annual. These layers in the creationist model may represent only
one year. So, the uniformitarian scientists in actuality would be counting storm
layers or other cycles of weather that can often duplicate the annual cycle.7
For instance, a storm has a warm and cold sector with different measurements of
the variables, producing a cycle in the variables. These storm oscillations may
be on the order of several days. Even the uniformitarian scientists recognize
that storms and other phenomenon, like moving snow dunes, may result in the
counting of an annual cycle, as Alley and others8
state:
Fundamentally, in counting any annual marker, we must ask
whether it is absolutely unequivocal, or whether nonannual events could
mimic or obscure a year. For the visible strata (and, we believe, for any
other annual indicator at accumulation rates representative of central
Greenland), it is almost certain that variability exists at the subseasonal
or storm level, at the annual level, and for various longer periodicities
(2-year, sunspot, etc.). We certainly must entertain the possibility of
misidentifying the deposit of a large storm or a snow dune as an entire year
or missing a weak indication of a summer and thus picking a 2-year interval
as 1 year.
Have they measured 700,000 years in the Antarctic ice sheet?
The method of counting annual layers only works with the high
accumulation Greenland ice sheet. However, the deep Antarctic ice sheet cores
have been dated to over 300,000 years showing multiple ice age cycles. The new
deep Dome C ice core from the top of the Antarctic ice sheet is claimed to have
drilled seven ice age cycles for a total of about 700,000 years near the bottom.
Are these ages objective?
Except for coastal ice cores that show
only one ice age cycle, the Antarctica ice sheet is dated by assuming
that the astronomical theory of the ice age is correct.9
In fact, this assumption also undergirds the annual layer dating of the
Greenland ice sheet.10 This is how they
obtain three or more ice age cycles, with each cycle being 100,000 years long.
They simply count the assumed number of ice age cycles and multiple by 100,000
years, the assumed period for the astronomical theory. These dates are not
objective; they simply are based on the assumption of the astronomical theory
and old age, which was discussed in
chapter 6.
It is easy to reinterpret the data from the ice sheet within the creationist’s
framework, as we will see in the next section.
Greenland and Antarctica ice sheets — remnants of the post-Flood Ice Age
At the peak of the Ice Age, the average thickness of the ice
sheets in the Northern Hemisphere was estimated to be 2,300 feet (700 m), while
on Antarctica it was 3,900 feet (1,200 m). The ocean water was still relatively
warm at an average of 50°F (10°C). It still needed to cool another 11°F (6°C) to
reach the current average of 39°F (4°C). The relatively warm water adjacent to
Greenland and Antarctica during deglaciation would have continued to cause
significantly greater ocean evaporation resulting in relatively high
precipitation to fall on the Greenland and Antarctic ice sheets.
If the rate of ice growth after the
peak of the Ice Age continued, 30 percent more ice would be added to Greenland
and Antarctica as the ocean cooled to its present temperature in the 200 years
of deglaciation. At the end of this period, the average ice depth on Greenland
would be about 3,000 feet (900 m) and Antarctica around 5,000 feet (1,525 m).
The average depth of the Greenland ice sheet today is 5,250 feet (1,600 m) with
a maximum depth of 11,045 feet (3,367 m).11
The current average thickness for the Antarctic ice sheet is 6,230 feet (1,900
m) with a maximum of around 13,775 feet (4,200 m).12
The average precipitation in water
equivalent on the Greenland ice sheet is 12 in/yr (30 cm/yr) with more than 60
in/yr (150 cm/yr) on the southeast corner and below 8 in/yr (20 cm/yr) for a
substantial part of the high northern half of the ice sheet.13
The average precipitation for Antarctica is 7 in/yr (19 cm/yr), which varies
from relatively high values near the coast to around 2 in/yr (5 cm/yr) for the
majority of the high East Antarctica ice sheet.14
It is interesting that the precipitation is so low over the high altitudes of
the Antarctic ice sheet that the region is considered a polar desert.
The precipitation of the southeast
Greenland ice sheet is surprisingly high. During World War II, six P-38
Lightning fighters and two B-17 Flying Fortress aircraft were forced to ditch on
the southeast Greenland ice sheet, 18 miles (29 km) from the ocean. A team went
back to recover them in the late 1980s and discovered that the planes were
buried under 260 feet (80 m) of ice and snow that had accumulated since 1942!15
These planes did not end up buried in the ice and snow because they absorbed
solar radiation and sank into the ice sheet. They are at this depth because of
the high precipitation that covered them. Such high precipitation is not typical
for the remainder of the ice sheet, but gives us a hint of the possibilities
when the ice sheet was much lower and the climate much different in the Ice Age.
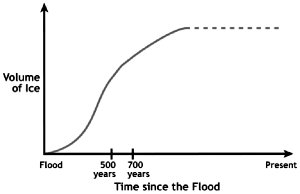
Figure 12.5. Time-line for the buildup of the
Greenland and Antarctica ice sheets from the time of the Flood to
the present. |
Based on strict biblical chronology and assuming no gaps in the
ancestral lists, the Ice Age ended about four thousand years ago. Since then,
many hundreds of feet of ice would be added to the Greenland and Antarctica ice
sheets. Of course, ice would also be lost during this time. This loss would
mainly be from surface melting, which is only significant on the Greenland ice
sheet, and iceberg calving. In spite of melting and calving, these two ice
sheets very likely continued to build to their present altitudes in the 4,000
years since the end of the Ice Age.
The model presented in this book can
account for the current prominence of the Greenland and Antarctica ice sheets
during a short Ice Age of about 700 years and the present climate for another
3,700 years.16 Figure 12.5 shows a
time-line for the buildup of the ice sheets from the end of the Flood to the
present.
Wild ice core interpretations during the Ice Age
The uniformitarian interpretation of
the “annual layers” within the bottom half or Ice Age portion of the ice cores
drilled near the top of the Greenland ice sheet has resulted in some wild ideas.17
Some of the variables in the lower sections of the cores show dramatic and rapid
changes (figure 12.6). Based on their uniformitarian assumption, mainstream
scientists are now forced to come to strange conclusions. They see these
oscillations within the Ice Age as representing temperature changes on Greenland
possibly up to 36°F (20°C) in periods as short as a few decades!18
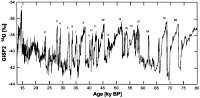
Figure 12.6. Plot of
oxygen isotope fluctuation, considered proportional to temperature,
during the Ice Age in the GISP2 ice core (from M. Schultz19).
View full-size. |
Such oscillations continue down into
the very bottom of the cores, thought to represent the previous interglacial
period. Some scientists think these oscillations are radical temperature changes
during an interglacial. Since we live in a supposed interglacial, such radical
changes are considered possible in today’s climate. Since these core changes
probably represent the climate around the North Atlantic Ocean, climate
researchers fear that the present climate could undergo a similar change in the
future, induced possibly by global warming.20
Currently, they are desperately searching for some sort of mechanism that would
cause such catastrophic climate change to explain these oscillations in the very
bottom of the ice cores. They are considering a few possibilities, such as a
halting of the ocean currents in the North Atlantic Ocean. However, other
scientists believe the very bottom of the Greenland ice sheet was disturbed by
ice sheet flow, and the oscillations, therefore, are climatically meaningless.
In the creationist model, on the other hand, such rapid
oscillations, whether in the Ice Age portion or the lower supposed interglacial
portion, could simply be the signature of annual layers or decadal
temperature changes caused by variable amounts of volcanic dust and aerosols in
the stratosphere. This is because the creationist annual layer is so much
thicker in this part of the ice core. Therefore, we do not have to fear the
possibility of a catastrophic climate change in the near future. http://www.answersingenesis.org/home/area/fit/chapter12.asp


